  |
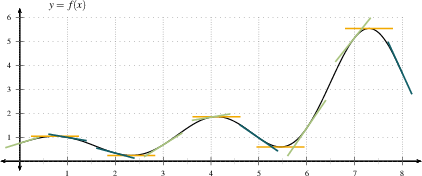
The graphs of $y=f(x)$ and $y=f'(x)$ are closely related. Since
$f'(a)$ represents the slope of the tangent line to $y=f(x)$ at
$\left(a, f(a)\right)$, the slope of $y=f(x)$ at $x$ is the
same as the height of the graph $y=f'(x)$ at that $x$, as
illustrated below.
|
|
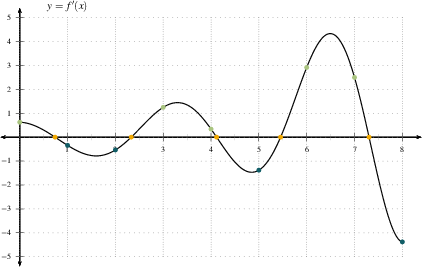
In the first figure, the tangent lines with positive slope are colored light green, the horizontal tangent lines are colored orange, and the tangent lines with negative slope are colored teal. The slopes of these tangent lines are the heights of the corresponding light green, orange and teal points in the second figure.
Note that wherever $f(x)$ is increasing, $f'(x)$ is positive. Wherever $f(x)$ is increasing rapidly, as between $x=6$ and $x=7$, $f'(x)$ is very positive, and the graph of $f'(x)$ is high. Wherever $f(x)$ is increasing slowly, as between $x=0$ and $x=1$, or between $x=3$ and $x=4$, $f'(x)$ is positive but small. Wherever the graph of $f(x)$ flattens out, the value of $f'(x)$ is zero and the graph of $f'(x)$ hits the $x$ axis. Wherever $f(x)$ is decreasing, $f'(x)<0$ and the graph of $f'(x)$ lies below the $x$ axis.