The graphs of $y=f(x)$ and $y=f'(x)$ are closely related. Since
$f'(a)$ represents the slope of the tangent line to $f$ at $x=a$,
the slope of $y=f(x)$ at $x$ is
the same as the height of the
graph $y=f'(x)$ at that $x$.
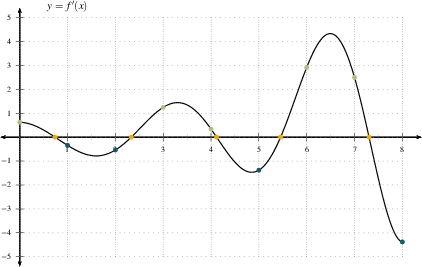
For example, if (see the first graph below) the slope of the tangent
line to $f$ at $x=7.2$ is $0$, then that means that
$f'(7.2)=0$. What this means on the graph of $f'$ (see the
second graph below) is that $f'$ has the height of $0$ at
$x=7.2$. Which is exacly what $f'(7.2)=0$ indicates.
Remember, $f'$ is a function that we have graphed.
Considering the graphs of $f$ and $f'$ above, DO: Look at the slope of the tangent to $f$ (top
graph) at $x=~.8$. See if the height of $f'$ (bottom graph)
is close to the slope you estimated on $f$. Now approximate
the slope of the line tangent to $f$ at $x=3$ (you can use the
grid to help approximate this value). Does it match the
height of $f'$ at $x=3$? Keep playing this game until you
are comfortable with the concept. The easiest points to consider are the places on
$f$ where the slope of the tangent is horizontal. What
happens at these $x$-values to $f'$?