At a point $P=(a,\,b,\, f(a,\,b))$ on the graph of $z = f(x,\, y)$
|
|
Example 1: Determine whether $f_x ,\ f_y$ are positive, negative, or zero at the points $P,\ Q, \ R,$ and $S$ on the surface to the right.
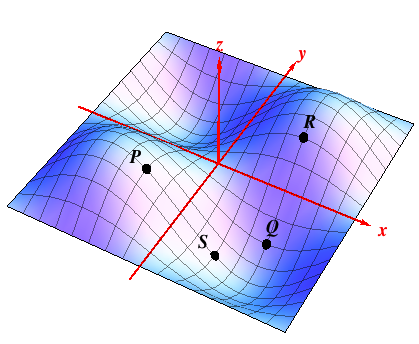
Solution: at $Q$, for instance, the surface slopes up for fixed $x$ as $y$ increases, so $f_y\bigl|_{Q} > 0$, while the surface remains at a constant level at $Q$ in the $x$ direction for fixed $y$, so $f_x\bigl|_{Q}= 0$. On the other hand, $$f_x\bigl|_{R} \,=\,0,\quad f_y\bigl|_{R} \,>\, 0\,, \qquad f_x\bigl|_{P} \,<\, 0,\, \quad f_y\bigl|_{P} \,=\, 0 \,.$$ But what happens at $S$? |
|
All the same ideas carry over in exactly the same way to functions $w = f(x,\,y,\,z)$ of three or more variables - just don't expect lots of pictures!! The partial derivative $f_z$, for instance, is simply the derivative of $f(x,\,y,\,z)$ with respect to $z$, keeping the variables $x$ AND $y$ fixed now.
Information about the partial derivatives of a function $z = f(x,\,y)$ can be detected also from the contour map of $f$. Indeed, as one knows from using contour maps to learn whether a path on a mountain is going up or down, or how steep it is, so the sign of the partial derivatives of $z = f(x,\,y)$ and relative size can be read off from the contour map of $f$.
|
Example 2: To the right is the contour map of the earlier function
$$z \ = \ f(x,\, y) \ = \ 3x^2 -y^2 -x^3 +2\,,$$
with 'higher ground' being shown in lighter colors and 'lower ground' in darker colors. Determine whether $f_x,\, f_y$ are positive, negative, or zero at $P,\, Q,\, R,\, S$, and $T$.
At $R$, for instance, are the contours increasing or decreasing as $y$ increases for fixed $x$? That will indicate the sign of $f_y$. But what happens at $P$ or at $S$? |
|