| Population | One Simple Random
Sample y1, y2, ... , yn |
All Simple Random Samples of size n | |
| Associated Mean(s) | Population mean µ, also called E(Y), or the expected value of Y, or the expectation of Y. | Sample mean ȳ = (y1+ y2+ ... + yn)/n | 1) Each sample has its own mean ȳ.
This allows us to define a random variable Ȳn.
The population for Ȳn
is all simple random samples from Y. The
value of Ȳn for
a particular simple random sample is the sample mean ȳ
for that sample. 2) Since it is a random variable, Ȳn also has a mean, E( Ȳn). Using the model assumptions for this particular example, it can be proved that E( Ȳn) = µ. In other words, Y and Ȳn have the same mean as random variables. |
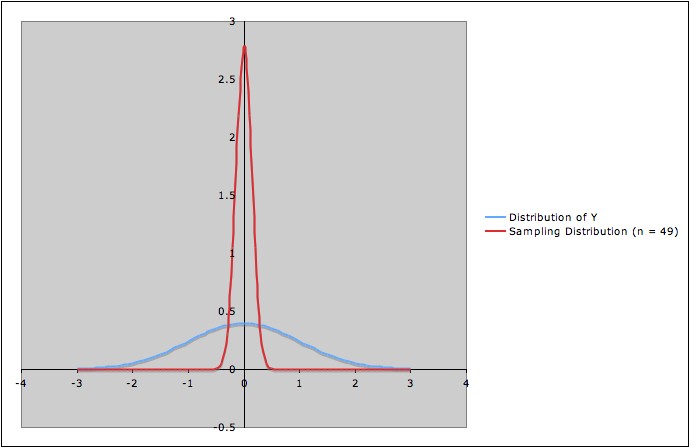
| Associated Distribution | Distribution of Y | None | Sampling Distribution (Distribution of Ȳn ) |
