COMMON MISTEAKS
MISTAKES IN
USING STATISTICS: Spotting and Avoiding Them
Using confidence
intervals when prediction intervals are needed
As pointed out in the discussion of overfitting in regression, the model
assumptions for least squares regression assume that the conditional
mean function E(Y|X = x) has a
certain form; the regression estimation procedure then produces a
function
of the specified form
that estimates the true conditional mean function.
For example, if the model assumption is that
E(Y|X=x) = α
+βx,
then least squares regression will produce an equation of the form
y = a
+bx,
where a is an estimate of the true value α
and
b is an estimate of the true value β.
Thus for a particular
value of x,
ŷ = a
+bx
is the estimate of E(Y|X = x).
But now suppose we want to estimate
an actual value of Y when X =
x, rather than just the conditional mean E(Y|X = x). The
only estimate available for an actual value of Y is ŷ
= a
+bx, the same thing we used to estimate E(Y|X
= x). But since Y
is a random variable (whereas E(Y|X = x) is a single number, not a
random variable), we cannot
expect to estimate Y as precisely as we
can estimate the conditional mean E(Y|X=x);
i.e., even if ŷ is a good estimate of the
conditional mean E(Y|X = x), it might be a very
crude
estimate of an actual value of Y.
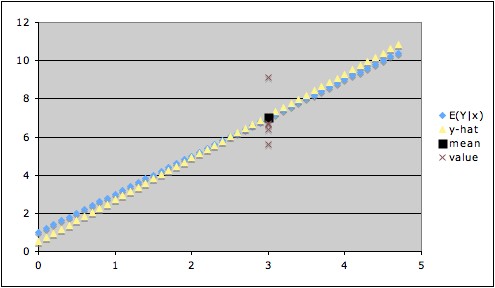
The graph below illustrates this. The
blue line is the actual line
of conditional means, the yellow
line is
the calculated regression line, the brown
x's show some values of Y when x = 3,
and the black square shows
the value of the conditional mean of Y when
x = 3. In this example, the estimate ŷ for x = 3
is
virtually indistinguishable from the conditional mean when x = 3,
so ŷ is a very good estimate of the
conditional mean. But if we are trying to estimate Y when x = 3, our
estimate ŷ (black square) might be way off --
for example, the
value of Y might turn out to be at the highest brown x or at the
lowest. This illustrates how the
uncertainty of ŷ
as an estimate of Y is much greater than the uncertainty of ŷ
as an estimate of the conditional mean of Y.
To estimate the uncertainty in our estimate of the
conditional mean E(Y|X = x), we can construct a confidence interval for the conditional mean. But, as
we have seen, the uncertainty in our estimate of Y when X = x is
greater than our uncertainty of E(Y|X = x). Thus, the confidence interval for the
conditional mean underestimates
the uncertainty in our use of ŷ as an estimate of a value of Y|(X = x).
Instead, we need what is called a prediction interval,
which takes into account the variability in the conditional
distribution Y|(X = x) as well as the uncertainty in our estimate of
the conditional mean E(Y|(X = x).
Example:
With the data used to
create the above plot, the 95% confidence interval for the conditional
mean when x = 3 is (6.634, 7.568) (giving a margin of error of about
0.5) , and the 95% prediction interval for Y when x = 3 is (5.139,
9.062) (giving a margin of error of about 2) .
(Note that the prediction interval includes all of the y-values
associated with x = 3 in the data used, except for the highest one,
which it misses by a hair.)
Comments:
1. For large enough sample size, the least squares estimate of the
conditional mean is fairly robust to departures from the model
assumption of normality of errors. This depends on the Central Limit
theorem and the fact that the formula for ŷ
can be expressed as a linear combination of the y-values for the data.
However, since the t-statistic used in calculating the prediction
interval also involves the conditional distribution directly, prediction is less robust to departures
from normality.
2. The distinction between variability
and uncertainty is useful in understanding the distinction between
confidence intervals for the conditional mean and prediction intervals:
The confidence interval for the conditional mean measures our degree of
uncertainty in our estimate of
the conditional mean; but the prediction interval must also take into
account the variability in
the conditional distribution1.
Notes:
1. In fact, for least squares simple linear regression,
- The width of the confidence
interval depends on the variance of ŷ =
ax + b
as an estimator of E(Y|X = x),
- whereas the width of the prediction
interval depends on the variance of ŷ
as an estimator of Y|(X = x).
- The variance of ŷ as an
estimator of Y|(X = x) is the
sum of the conditional variance (usually denoted σ2)
and the variance of ŷ as an estimator of
E(Y|X = x).
- The first term (σ2)
is a measure of the variability in the
conditional distribution;
- the second term (the variance of ŷ
as an estimator of
E(Y|X = x)) is a measure of the uncertainty in
the estimate of the conditional mean.
- The conditional variance σ2
typically is the larger of these two terms.