This
site is under construction. Please check back every few weeks for
updates
COMMON MISTEAKS
MISTAKES IN
USING STATISTICS: Spotting and Avoiding Them
Extrapolation Beyond the Range of the Data
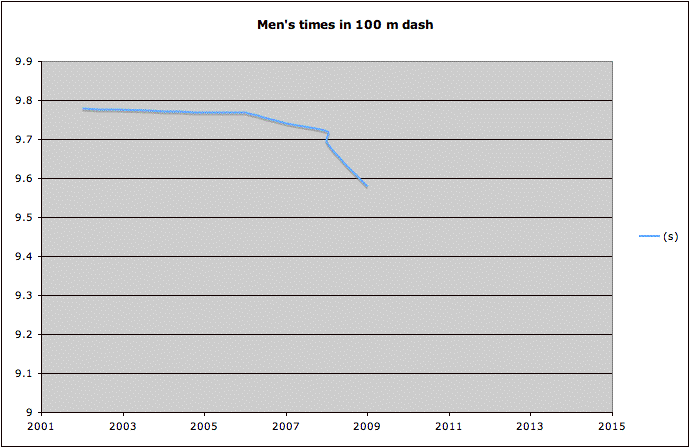
Example: The following graph
shows a curve fitted to men's best times in the 100 m dash for 2001
through 2009.
If the trend for years before 2006 had been used to predict
the times for 2008 and 2009, the estimate would be noticeably over the
actual times. If the trend for 2008 to 2009 is used to predict the time
for 2013, we would have some very amazing times.
In some instances, the purpose of a study is indeed to predict what
will happen next month or next year, based on recent data. The
researcher has to do the best they can. But predicting farther in the
future leads to more uncertainty.
A similar problem occurs, but is not so easy to detect, when
considering more variables.
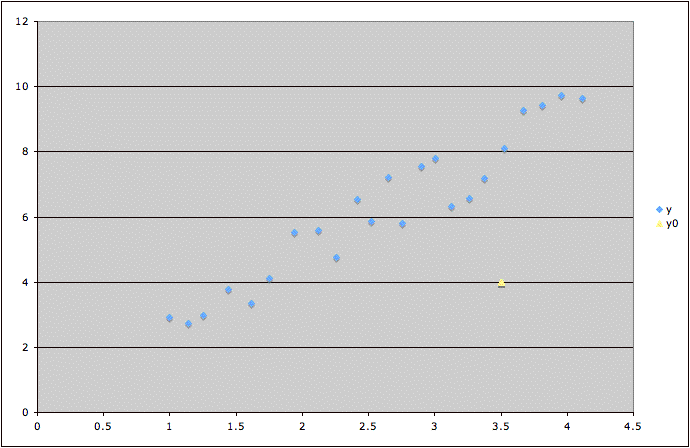
Example: Consider a study
whose purpose is to try to predict variable z in terms of variables x
and y. Suppose the graph below shows the plot of y versus x values for
the data
in blue,
but it is desired to predict z
for a case where the x and y values are shown by the yellow point. This prediction could
be considered extrapolation beyond the range of the data, since the
blue data points all lie within a roughly elliptical region, but the
yellow point lies noticeably outside that region. (Note that in this
example, we can detect that the yellow point lies outside the range of
the data simply by graphing the data. In situations with more
variables, the Mahalanobis distance
is sometimes appropriate to detect possible extrapolation beyond the
range of the data.)


