Main page
Chapter 10: Parametric Equations and Polar Coordinates
Chapter 12: Vectors and the Geometry of Space
Chapter 13: Vector Functions
Chapter 14: Partial Derivatives
Learning module LM 14.1: Functions of 2 or 3 variables:
Learning module LM 14.3: Partial derivatives:
6 pillars of calculus (revisited)Geometry of partial derivatives
Higher partial derivatives
Learning module LM 14.4: Tangent planes and linear approximations:
Learning module LM 14.5: Differentiability and the chain rule:
Learning module LM 14.6: Gradients and directional derivatives:
Learning module LM 14.7: Local maxima and minima:
Learning module LM 14.8: Absolute maxima and Lagrange multipliers:
Chapter 15: Multiple Integrals
Geometry of partial derivatives
|
Start with
$$z \ = \ f(x,\, y) \ = \ 3x^2 -y^2 -x^3 +2$$
whose graph is shown to the right. Then
$$f_x \ = \ \frac{\partial f}{\partial x} \ = \ \frac{\partial } {\partial x}\, \bigl( 3x^2 -y^2 -x^3 +2\bigl) \ = \ 6x -3x^2 \,.$$
To exploit interactivity, fix $y = -1$ and use the 'Fix $y$'-slider to intersect the graph of $f$ by the plane $y = -1$. The cubic curve of intersection shown in orange
is the graph of the vector function
$${\bf r}(x)\, = \, \bigl\langle\, x,\, -1,\, f(x,\,-1)\,\bigl\rangle\,=\, \bigl\langle\, x,\, -1,\, 3x^2 -x^3 +1\,\bigl\rangle\,,$$
(use 'Curve 1'-slider). The tangent vector to this orange curve is
$${\bf r}'(x)\ = \ \bigl\langle\, 1,\, 0,\, 6x -3x^2\,\bigl\rangle \ = \ \bigl\langle\, 1,\, 0,\, f_x\,\bigl\rangle\,,$$
(use 'Tangent Vector 1' button). Thus $f_x$ gives the slope of the graph of $z = f(x,\,y)$
in the $x$-direction.
If we fix $x= 1$, say, and use the other sliders and button, we see that $f_y$ gives the slope of the graph of $z = f(x,\,y)$ in the $y$-direction. Thus |
At a point $P=(a,\,b,\, f(a,\,b))$ on the graph of $z = f(x,\, y)$,
 the value $\displaystyle\frac{\partial f}{\partial x}\Bigl|_{(a,\,b)}$ is the Slope in the $x$-direction,
$\displaystyle \Bigl\langle \, 1,\, 0,\, \frac{\partial f}{\partial x}\Bigl|_{a,\,b}\,\Bigl \rangle$ is
a Tangent Vector in the $x$-direction, while
$$\frac{\partial f}{\partial y}\Bigl|_{(a,\,b)}\,, \qquad \qquad \Bigl\langle \, 0,\, 1,\, \frac{\partial f}{\partial
y}\Bigl|_{a,\,b}\,\Bigl \rangle$$
give the respective slope and tangent vector at $P$ in the $y$-direction.
the value $\displaystyle\frac{\partial f}{\partial x}\Bigl|_{(a,\,b)}$ is the Slope in the $x$-direction,
$\displaystyle \Bigl\langle \, 1,\, 0,\, \frac{\partial f}{\partial x}\Bigl|_{a,\,b}\,\Bigl \rangle$ is
a Tangent Vector in the $x$-direction, while
$$\frac{\partial f}{\partial y}\Bigl|_{(a,\,b)}\,, \qquad \qquad \Bigl\langle \, 0,\, 1,\, \frac{\partial f}{\partial
y}\Bigl|_{a,\,b}\,\Bigl \rangle$$
give the respective slope and tangent vector at $P$ in the $y$-direction.
|
|
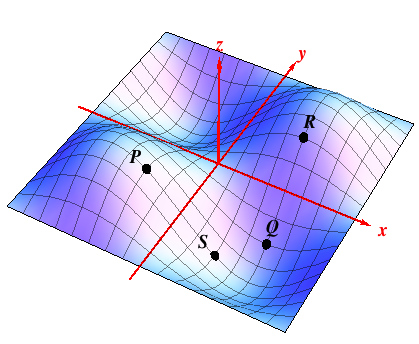
Example 1: Determine whether $f_x ,\ f_y$ are
positive, negative, or zero at the points $P,\ Q, \ R,$ and $S$ on the
surface to the right.
Solution: at $Q$, for instance, the surface slopes up for fixed $x$ as $y$ increases, so $f_y\bigl|_{Q} > 0$, while the surface remains at a constant level at $Q$ in the $x$ direction for fixed $y$, so $f_x\bigl|_{Q}= 0$. On the other hand, $$f_x\bigl|_{R} \,=\,0,\quad f_y\bigl|_{R} \,>\, 0\,, \qquad f_x\bigl|_{P} \,<\, 0,\, \quad f_y\bigl|_{P} \,=\, 0 \,.$$ But what happens at $S$? |
|
All the same ideas carry over in exactly the same way to functions $w = f(x,\,y,\,z)$ of three or more variables - just don't expect lots of pictures!! The partial derivative $f_z$, for instance, is simply the derivative of $f(x,\,y,\,z)$ with respect to $z$, keeping the variables $x$ AND $y$ fixed now.
Information about the partial derivatives of a function $z = f(x,\,y)$ can be detected also from the contour map of $f$. Indeed, as one knows from using contour maps to learn whether a path on a mountain is going up or down, or how steep it is, so the sign of the partial derivatives of $z = f(x,\,y)$ and relative size can be read off from the contour map of $f$.
|
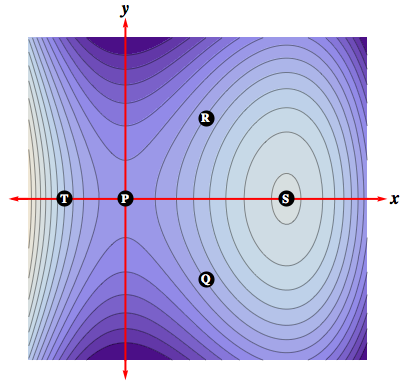
Example 2: To the right is the
contour map of the earlier function
$$z \ = \ f(x,\, y) \ = \ 3x^2 -y^2 -x^3
+2\,,$$ with 'higher ground' being shown in lighter colors and
'lower ground' in darker colors. Determine whether $f_x,\, f_y$ are
positive, negative, or zero at $P,\, Q,\, R,\, S$, and $T$.
At $R$, for instance, are the contours increasing or decreasing as $y$ increases for fixed $x$? That will indicate the sign of $f_y$. But what happens at $P$ or at $S$. Don't forget that the graph of $f$ appears in the earlier interactive animation! |
|