COMMON MISTEAKS
MISTAKES IN
USING STATISTICS: Spotting and Avoiding Them
Factors that Affect the Power of a Statistical Procedure
As discussed on the page Power of a Statistical Procedure, the
power of a statistical procedure depends on the specific alternative
chosen (for a hypothesis test) or a similar specification, such as
width of confidence interval (for a confidence interval).
The following factors also influence power:
1. Sample Size
Power depends on sample size. Other things being
equal, larger sample size yields higher power. Example and more details.
2. Variance
Power also depends on variance: smaller variance yields
higher power.
Example:
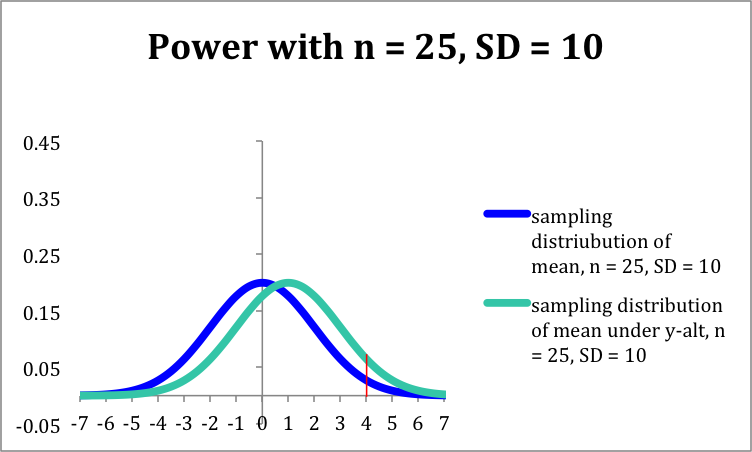
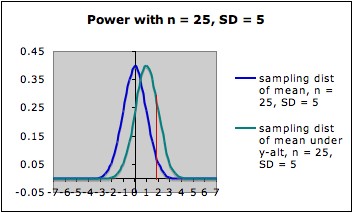
The pictures below
each show the sampling distribution for the mean under the null
hypothesis µ = 0 (blue -- on the left in each picture) together
with the sampling distribution under the alternate hypothesis µ
= 1 (green -- on the right in each picture), both with sample size 25,
but for different standard
deviations of the underlying distributions. (Different standard
deviations might arise from using two different measuring instruments,
or from considering two different populations.)
- In the first picture, the standard deviation is 10; in the
second picture, it is 5.
- Note that both graphs are
in the same scale. In both
pictures, the blue curve is centered at 0 (corresponding to the the
null
hypothesis) and the green curve is centered at 1 (corresponding to the
alternate hypothesis).
- In each picture, the red line is the cut-off for rejection
with alpha = 0.05 (for a one-tailed test) -- that is, in each picture,
the area under the blue curve
to the right of the red
line is 0.05.
- In each picture, the area under the green curve to the right of the red
line is the power of the test against the alternate depicted. Note that
this area is larger in the
second picture (the one with smaller standard deviation) than in the
first
picture.
The Claremont
University's Wise Project's Statistical Power Applet and the Rice
Virtual Lab in Statistics' Robustness Simulation can be used to
illustrate this dependence in an interactive manner.
Variance can sometimes be reduced by using a better measuring
instrument, restricting to a subpopulation, or by choosing a better
experimental design (see below).
3. Experimental Design
Power can sometimes be
increased by adopting a different experimental design that has lower
error variance. For example,
stratified sampling or blocking can often reduce error variance and
hence increase power. However,
For more on designs that may increase power, see:
- Lipsey, MW
(1990). Design sensitivity:
Statistical power for experimental research. Newbury Park, CA:
Sage.
- McClelland, Gary H. (2000) Increasing statistical power
without increasing sample size, American
Psychologist 55(8), 963
- 964
Last updated June 2012


