COMMON MISTEAKS
MISTAKES IN
USING STATISTICS: Spotting and Avoiding Them
Power and Sample Size
Power will depend on sample size as well
as on
the difference to be detected.
Example:
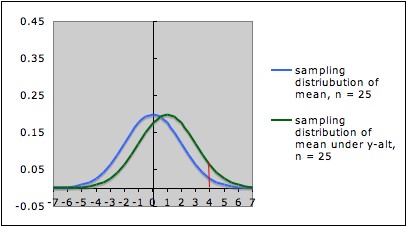
The pictures below
each show the sampling distribution for the mean under the null
hypothesis µ = 0 (blue -- on the left in each picture) together
with the sampling distribution under the alternate hypothesis µ
= 1 (green -- on the right in each picture), but for different sample sizes.
- The first picture is for sample size n = 25; the
second picture is for sample size n = 100.
- Note that both graphs are in the same scale. In both
pictures, the blue curve is centered at 0 (corresponding to the the
null
hypothesis) and the green curve is centered at 1 (corresponding to the
alternate hypothesis).
- In each picture, the red line is the cut-off for rejection
with alpha = 0.05 (for a one-tailed test) -- that is, in each picture,
the area under the blue curve
to the right of the red
line is 0.05.
- In each picture, the area under the green curve to the right of the red
line is the power of the test against the alternate depicted. Note that
this area is larger in the
second picture (the one with larger sample size) than in the first
picture.
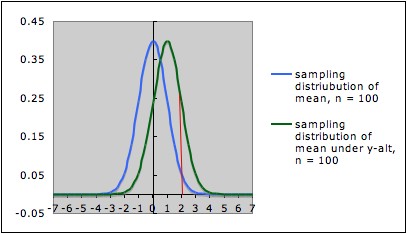
This illustrates the general situation: Larger sample size gives larger power. The
reason is
essentially the same as in the example: Larger sample size gives a
narrower sampling distribution, which means there is less overlap in
the two sampling distributions (for null and alternate hypotheses).
Comments:
- See Claremont
University's Wise Project's Statistical Power Applet for an
interactive demonstration of the interplay between sample size and
power for a one-sample z-test.
- Sample size needed typically increases at an increasing rate
as power increases. (e.g., in the above example, increasing the sample
size by a factor of 4 increases the power by a factor of about 2; the
graphics aren't accurate enough to show this well.)
Choosing sample size
The dependence of power on sample size allows us (in principle)
to figure out before doing a study what sample size is needed to detect
a
specified difference, with a specified power, at a given
significance level, if
that difference is really there. In
practice, details
on figuring out sample size will vary
from
procedure to procedure. Some considerations involved:
- The
difference used in
calculating sample size (e.g., the specific alternative used in
calculating sample size, or the size of confidence interval desired)
should be decided on the basis of practical
significance and/or "worst case scenario," depending on the
consequences of decisions.
- Even when the goal is a hypothesis test, it may be wise to
base the sample size on the width of a confidence interval rather than
just ability to detect the desired difference: Even when power is large
enough to detect a difference, the uncertainty, as displayed by the
confidence interval, may still be too large to make the conclusions
very credible to a knowledgeable reader.
- Determining sample size
to give desired power and significance level will usually require some
estimate of parameters
such as variance, so will only be as good as these
estimates. These estimates usually need to be based on previous
research, experience of experts in the field being studied, and
possibly a pilot
study. In some cases, it may be wise to use a conservative estimate of
variance (e.g., the upper bound of a confidence interval from a pilot
study), or to do a sensitivity analysis to see how the sample size
estimate depends on the parameter estimate. See Lenth,
Russell V. (2001) Some Practical Guidelines
for Effective Sample Size Determination, American Statistician, 55(3), 187 -
193 for a discussion of many considerations in deciding on sample size.
(An early version and some related papers can be downloaded from his
website.)
- Even when there is a good formula for power
in
terms of sample size, "inverting" the formula to get sample size from
power is often not straightforward; it may require some clever
approximation procedures. Such procedures have been encoded into
computer routines for many common tests. Increasingly, simulations are
being used to estimate power and needed sample size.
- Various statistical software packages have power
calculations available; however, be
sure that the software calculates a priori power, not retrospective
power.
(See item 7 under Common Mistakes
Involving Power.)
- Russell Lenth has online
applets for power and sample size for many common experimental
designs. His web page also has some suggestions to take into account in
calculating sample size.
- See John C.
Pezzullo's Interactive
Statistics Pages for links to a number of online power and sample
size calculators.
- Good and Hardin (2006, Common
Errors in Statistics, Wiley, p. 34) report that using the
default settings for power and sample size calculations is a common
mistake made by researchers.
- For discrete distributions, the "power function"
(giving power as a
function of sample size) is often saw toothed in shape. A consequence
is
that software may not necessarily give the optimal sample size for the
conditions specified. Good software for such power calculations will
also output a graph of the power function, allowing the researcher to
consider other sample sizes that might give be better than the default
given by the software.
Last updated May 12,
2011